In a world where assets are the backbone of operational success, effective management is crucial. The Asset Management Dashboard is designed to provide organizations with a comprehensive view of their assets, enabling them to optimize utilization, reduce costs, and enhance overall productivity. This dashboard transforms complex data into actionable insights, ensuring that businesses can make informed decisions that drive efficiency and profitability.
The Asset Management Dashboard is a simple, powerful tool that combines all key areas of asset management in one easy-to-use platform. It includes five main report pages: Inventory, Finance, Maintenance, Lifecycle, and Cost Optimization. Each page provides clear insights to help businesses manage assets better, cut costs, and improve overall efficiency.
Key Features
Unified Asset Visibility
Get a single view of all assets such as inventory, status, location, and value, through intuitive Power BI visuals.
Full Lifecycle Tracking
Follow each asset from purchase, through depreciation, to retirement with clear dashboards for planning replacements.
Cost Control & ROI Analysis
Analyze repair costs, operating expenses, and asset-generated savings to optimize budgets and prove return on investment.
Real-Time Monitoring & Alerts
See live updates on asset performance and receive automatic alerts for maintenance needs or cost overruns.
Predictive Maintenance Insights
Use historical trends and AI-driven forecasts in Power BI to schedule maintenance before breakdowns occur.
Role-Based Access & Data Security
Ensure the right teams see the right data with Power BI’s secure, role-based access controls, protecting sensitive asset and financial information across departments.
Tackling Challenges with Asset Management Insights
Challenge
Many organizations rely on disparate systems and spreadsheets to track asset information, resulting in inconsistent data and a lack of real-time insights.
Without a clear understanding of asset performance, companies may find themselves with underutilized or over-maintained assets, leading to unnecessary expenses.
Inefficient tracking of maintenance schedules can result in overdue repairs, increased downtime, and ultimately, higher operational costs.
Organizations often lack comprehensive financial insights related to asset acquisition, depreciation, and overall impact on profitability, making it difficult to make informed investment decisions.
Our Solution
By integrating data from various sources into a single dashboard, users gain real-time visibility into their asset portfolio. This eliminates the confusion of fragmented data and provides a clear, comprehensive view of asset performance.
The dashboard’s detailed insights allow organizations to identify underutilized assets and optimize their allocation. By tracking asset performance and maintenance needs, businesses can proactively manage their resources, reducing costs and improving efficiency.
With features that highlight upcoming maintenance schedules and overdue tasks, the dashboard ensures that assets are well-maintained, minimizing downtime and extending asset lifespans.
The Finance Report Page provides in-depth analysis of asset-related financials, including ROI, depreciation trends, and cost comparisons. This empowers organizations to make informed decisions regarding asset investments and financial planning.
Each report page is designed to provide actionable insights, enabling stakeholders to make data-driven decisions that enhance productivity and financial efficiency.
Dashboard Pages & Navigation
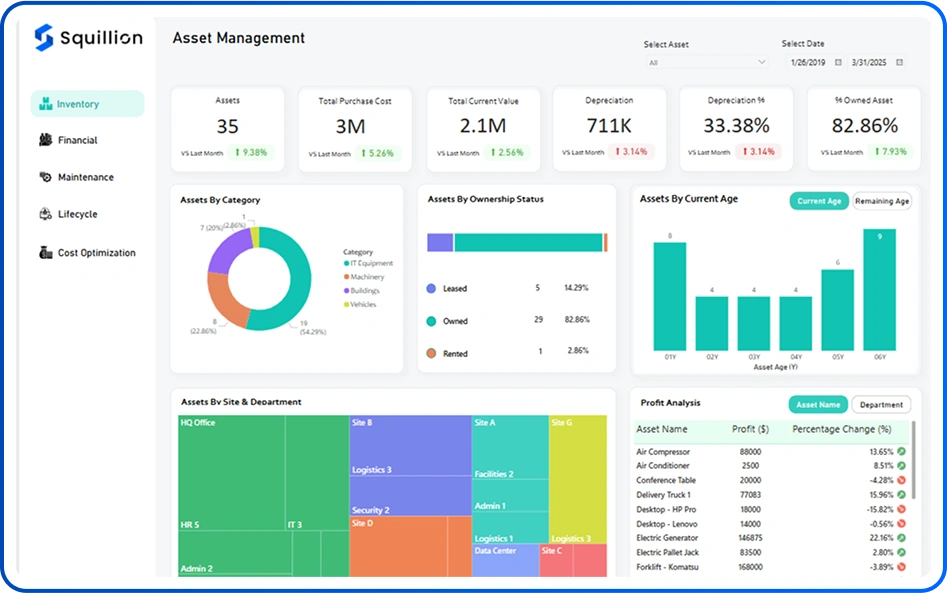
Inventory Report Page
Get a complete view of your asset inventory across all locations. This page helps you track asset quantities, categories, and utilization using dynamic Power BI tables and location-based map visuals. Easily identify stock shortages, overstocked assets, or unused resources to improve overall asset efficiency and stock control.
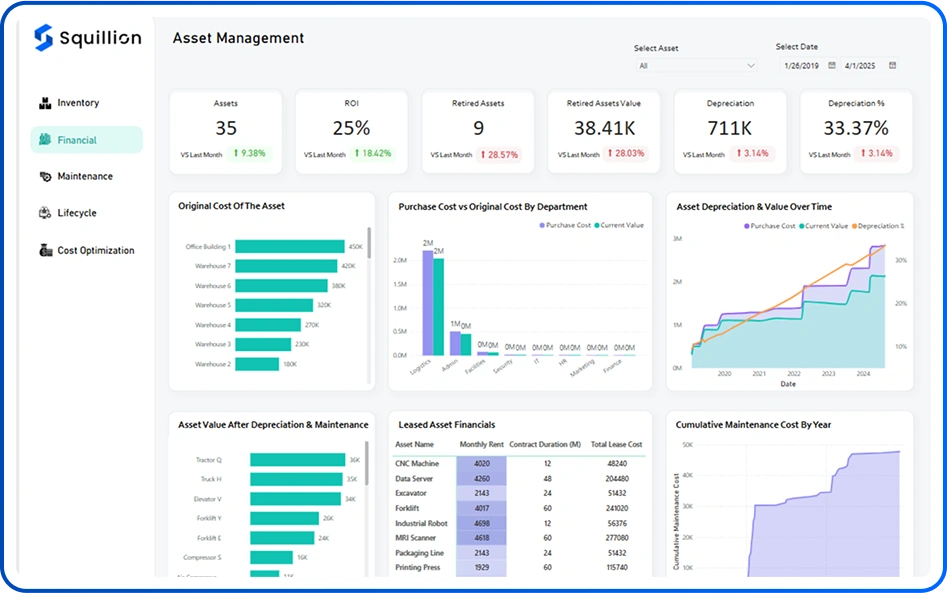
Finance Report Page
Understand the full financial picture of your assets. Visualize acquisition costs, current book value vs. market value, and asset depreciation over time. This page supports better financial forecasting and budgeting by showing how asset values evolve, helping you make informed investment and replacement decisions.
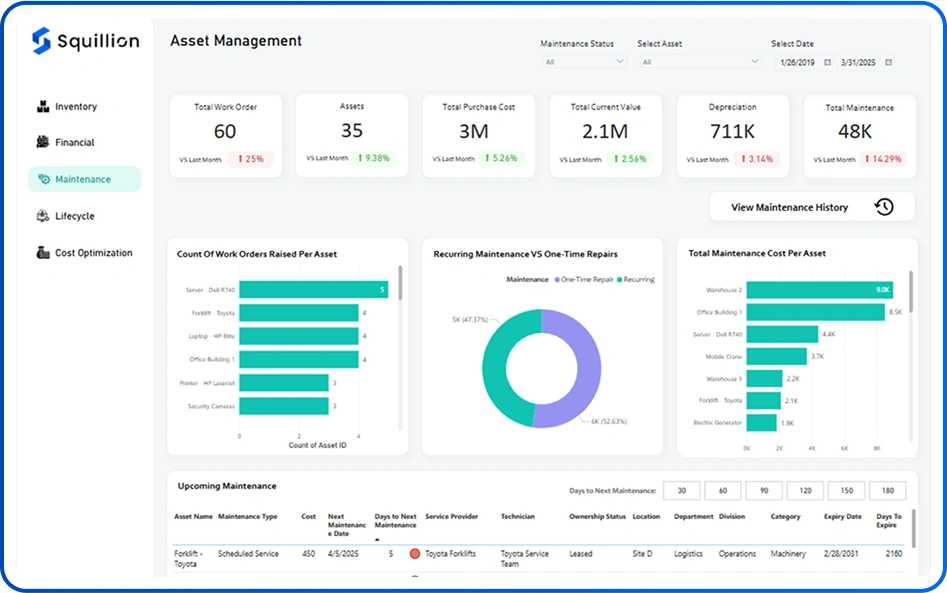
Maintenance Report Page
Stay ahead with proactive asset maintenance tracking. Monitor maintenance schedules, repair costs, and work order history using Power BI’s interactive features. Drill down by asset type, location, or vendor to identify frequently serviced assets or high-cost repairs, helping reduce downtime and improve service planning.
Lifecycle Report Page
Plan smarter asset replacement with lifecycle analytics. This page offers clear visibility into asset age, usage duration, and end-of-life timelines. Use lifecycle indicators and replacement forecasts to make data-driven decisions around upgrades, disposals, or reassignments, ensuring optimal asset performance.
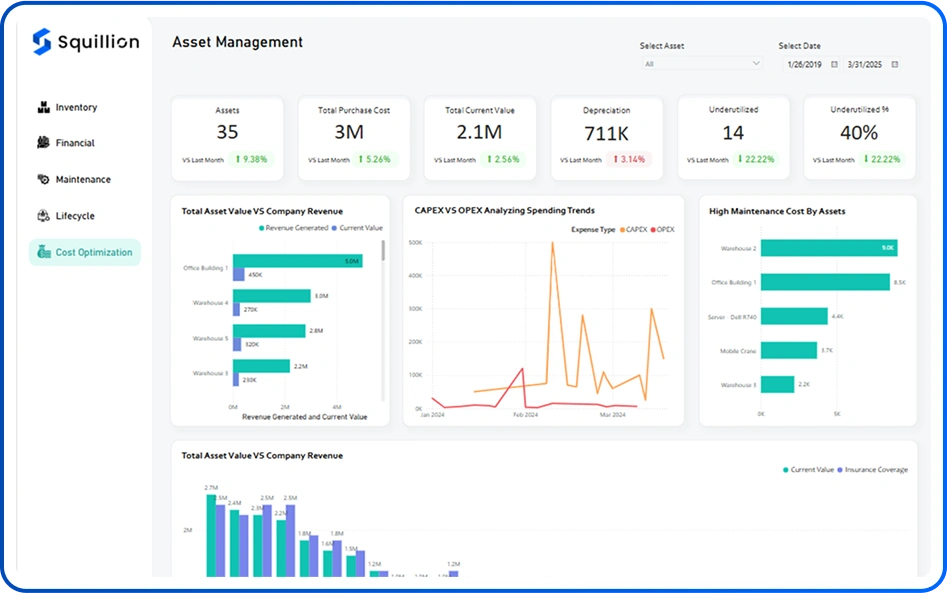
Cost Optimization Report Page
Unlock savings opportunities across your asset operations. Analyze spending trends, cost drivers, and efficiency metrics with KPI cards, filters, and Power BI slicers. This page helps you reduce unnecessary costs, identify budget leaks, and optimize resource allocation for maximum ROI on asset investments.
Key Insights
Asset Utilization Rates
Spot under‑used or over‑used equipment to rebalance resources and improve ROI.
High‑Cost Maintenance Items
Identify which assets or repair types are driving the biggest expenses.
Lifecycle Transition Forecasts
Predict when assets will reach retirement or require major upgrades.
Depreciation & Valuation Trends
Track how asset value changes over time for accurate financial reporting.
Spare Parts Stock‑Out Risks
Analyze consumption rates to prevent critical part shortages.
Vendor Performance Comparison
Compare service quality, costs, and lead times across maintenance providers.
FAQs
What is an Asset Management Dashboard?
It’s a visual tool that helps track, monitor, and manage company assets such as equipment, machinery, vehicles, and IT devices in real time.
What kind of data can I see on the dashboard?
You can view asset location, condition, maintenance schedules, usage history, depreciation, costs, asset lifespan, and more.
Who can use the dashboard?
Facility managers, operations teams, finance departments, and asset supervisors can all benefit from using the dashboard.
Can I track maintenance and service records?
Yes, the dashboard includes detailed maintenance history, upcoming service dates, and work order tracking.
Is it possible to monitor asset performance and health?
Absolutely. You can monitor key performance indicators (KPIs) like downtime, usage rates, and asset efficiency.
Can the dashboard help with asset replacement planning?
Yes, it provides insights into asset lifespan, depreciation, and usage, helping you plan replacements proactively.
Does it support real-time data updates?
Yes, the dashboard can pull live data from your systems, ensuring accurate and up-to-date insights.
Can I integrate the dashboard with our existing systems?
Yes, it can integrate with ERP, CMMS, Excel sheets, and other asset management tools.
Is the dashboard customizable?
Yes, it can be fully customized to show only the metrics and visuals that matter to your organization.
How do we get started with the Asset Management Dashboard?
Just reach out to our team we’ll help you set up a tailored solution that fits your business needs.