Power BI Dashboard /App
Transform how your organization monitors performance, analyzes trends, and makes strategic decisions using Power BI dashboards and tailored business intelligence applications. At Squillion Tech, we specialize in developing scalable, interactive Power BI solutions that convert complex datasets into easy-to-understand, real-time insights accessible across departments, devices, and user levels.
Power BI Dashboard Examples
Explore these interactive Power BI demonstrations to gain deep insights into your workplace analytics with guided dashboards.

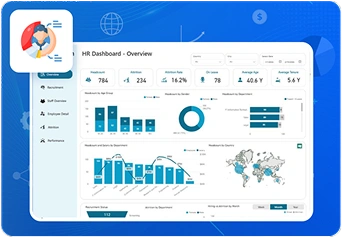
HR Analytics Dashboard
Optimize Recruitment, Retention, and Performance with Our HR Analytics Dashboard.
View More Get It Now
Financial Performance Dashboard
Use Our Financial Performance Dashboard to Track Revenue, Control Costs, and Maximize Profit.
View More Get It Now
Asset Management Dashboard
Maximize Asset Value with Smarter Insights and Real-Time Tracking
View More Get It Now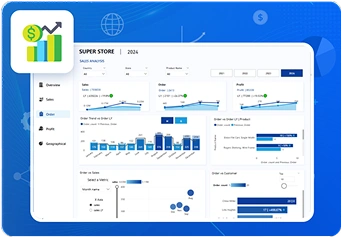
Sales Performance Dashboard
Get a real-time, unified view of revenue, orders, and profits. Explore trends by region, product, or customer segment, and make smarter decisions with interactive, drill-down Power BI visuals.
View More Get It Now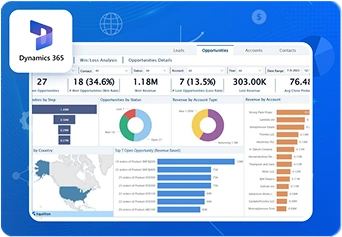
 Power BI App
Dynamics 365 CRM Analytics by Squillion
A powerful analytics app that delivers deep insights into CRM data, enabling effective sales management and customer relationship optimization.
View More Download Now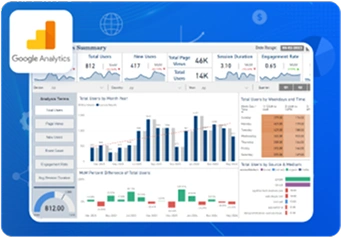
 Power BI App
Google Analytics by Squillion
An integrated analytics tool that provides comprehensive insights into website performance, helping businesses optimize their online presence.
View More Download NowWhat is a Power BI Dashboard?
A Power BI dashboard is a centralised, interactive platform designed to visualise, monitor, and analyse your organisation’s most critical KPIS and data insights.
Acting as a unified reporting hub, it pulls together data from diverse sources and presents it through intuitive and visually engaging charts, graphs, and interactive elements. Whether tracking sales metrics, operational efficiency, or customer behaviour, Power BI dashboards simplify complex data into compelling visual stories.
They are fully customizable and user-friendly, making them ideal for both technical users and business stakeholders. From pre-built templates to fully tailored designs, the ultimate goal of every Power BI dashboard is to turn raw data into actionable intelligence that drives smarter business decisions and supports long-term growth.
Why Use Power BI Dashboards?
Power BI dashboards function as the digital command center of modern businesses. By integrating data from both on-premises and cloud-based systems, they provide a 360-degree view of organizational performance.
Their interactive design enables users to apply filters, use slicers, and drill down into specific data points, making it easier to identify trends, spot anomalies, and make informed decisions. With real-time data streaming, your dashboards always reflect the most current business conditions.
Using Power BI dashboards enhances operational transparency, boosts team collaboration, and fosters a data-driven culture. Businesses that embrace data visualization tools like Power BI gain a competitive edge through faster, smarter, and more confident decision-making.

What We Deliver Through Power BI Dashboards

End-to-End Dashboard Development
Custom-built Power BI dashboards designed with interactive visuals, tailored layouts, and business-centric KPIs to meet your strategic goals.
Advanced Data Integration & Modeling
Robust data connections and transformation pipelines using Power Query and DAX ensuring clean, structured data from multiple sources.
Real-Time & Mobile-Ready Insights
Implementation of real-time dashboards optimized for mobile, delivering up to the minute insights across devices.
Security & Access Control
Setup of row-level security and permission-based access to ensure data confidentiality and compliance across departments.
Microsoft Ecosystem Integration
Seamless integration with Microsoft tools like Excel, Teams, and SharePoint for smooth collaboration and reporting workflows.
Publishing and Sharing
Users can publish dashboards to the Power BI service and share them with colleagues or stakeholders, facilitating collaboration.
Smart Features & Automation
Configuration of alerts, Q&A functionality, and automated refresh schedules to drive proactive, insight-driven decisions.Hire Power BI consultants certified by Microsoft Power BI
Web development services driven by Innovation & growth can improve company-customer relationships.
How Power BI Dashboards Benefit Your Business
Power BI dashboards are an important part of Microsoft’s analytics tools. They help businesses get real-time insights and make better decisions. Here are some key benefits for your business
Real‑Time Insights
See live data updates on your dashboard, so you always work with the latest numbers and can act quickly when conditions change.
Easy Data Visualization
Turn spreadsheets and reports into clear, interactive charts and graphs that anyone can understand no data science degree required.
Collaboration & Sharing
Share dashboards with a single link or embed them in Teams and SharePoint so your whole team can view, comment, and take action together.
Cost‑Effective Analytics
Choose from flexible Power BI licensing options that fit any budget, giving you enterprise grade analytics without the enterprise price tag.
Advanced Analytics
Leverage built‑in predictive analytics, AI visuals, and natural‑language Q&A to uncover trends and forecasts without complex setup.
Multi‑Source Data Connectivity
Connect your dashboard to cloud services, on‑premises databases, Excel files, and web APIs bringing all your data into one place.
How We Create Impactful Power BI Dashboards
Creating an interactive dashboard in Power BI is straightforward and highly effective. Follow these steps to build your own:
Connect to Data Sources
Start by connecting Power BI to your various data sources, such as Excel, SQL Server, or cloud services.
Manage Data Model Relationships
Ensure that all data relationships are correctly established within your data model to enable accurate analysis.
Calculate Necessary Measures
Create the measures you need for your analysis, such as sums, averages, or custom calculations, to derive meaningful insights.
Create a New Dashboard
Set up a new dashboard and choose the visualizations that best represent your data, such as charts, graphs, and maps.
Configure Visualizations
Use Power BI’s formatting options to customize and enhance your visualizations, adjusting colors, labels, and titles for clarity.
Add Interactivity
Incorporate slicers, filters, and drill-through features to allow users to interact with the data and explore different perspectives.
Design the Layout
Arrange your visualizations logically on the dashboard to create a cohesive and user-friendly layout.
Incorporate Tooltips
Add tooltips to provide additional context when users hover over data points, enhancing the user experience.
Save and Share
Save your dashboard and share it with your team for collaborative insights, setting appropriate access permissions.
Monitor and Update
Regularly review the dashboard’s performance and user engagement, updating it as needed based on feedback and changing business needs.
Why choose us?
At Squillion, we specialize in crafting powerful, user-centric Power BI dashboards and apps that transform complex data into clear, actionable insights. Here’s why clients trust us:

Tailored Solutions
We design dashboards that are fully customized to meet your unique business goals, industry, and data landscape.
End-to-End Expertise
From data modeling and DAX to report design and deployment, our team handles the entire BI lifecycle with precision and care.
Industry Experience
With expertise across HR, Finance, Sales, Marketing, and Operations, we deliver domain-specific dashboards that drive real results.
Interactive & Scalable Designs
Our dashboards are built to be scalable, mobile-friendly, and highly interactive, perfect for real-time decision-making.
Security & Compliance
We follow best practices to ensure your data is secure, confidential, and compliant with industry standards.
Ongoing Support & Training
We don’t just deliver dashboards, we empower your team with the knowledge and support they need to succeed long-term.FAQs
What is the difference between a Power BI Dashboard and a Report?
A Power BI Dashboard is a single-page, real-time view of your data, ideal for high-level monitoring. A Report, on the other hand, can span multiple pages and is used for detailed analysis and data exploration.
Who can use Power BI Dashboards?
Anyone from business executives and analysts to non-technical users can use Power BI Dashboards. They are designed to be intuitive, interactive, and accessible to all skill levels.
Can I connect Power BI Dashboards to multiple data sources?
Yes, Power BI supports integration with various data sources, including Excel, SQL Server, Dynamics 365, SharePoint, Google Analytics, and many more.
Are Power BI Dashboards updated in real-time?
Yes, dashboards can be configured to refresh automatically, providing real-time or near-real-time insights depending on the data source.
Can I access my dashboard on mobile devices?
Absolutely. Power BI dashboards are fully responsive and accessible via mobile apps for iOS and Android, making it easy to monitor performance on the go.
How secure is my data in Power BI Dashboards?
Power BI ensures enterprise-grade security with role-level access, encryption, and compliance with industry standards, so your data remains protected.
What is a Power BI App?
A Power BI App is a packaged collection of dashboards and reports that can be shared across your organization. It simplifies deployment and ensures consistency in insights.
Can I customize Power BI Dashboards and Apps?
Yes. You can fully customize dashboards and apps with your branding, visual themes, filters, and interactive elements to match your business needs.
Do I need coding knowledge to build a Power BI Dashboard?
No coding is required for building basic dashboards. However, using advanced DAX functions and custom visuals can enhance interactivity and insight depth.
How can Power BI Dashboards help my business?
They help you track KPIs, monitor performance, identify trends, and make data-driven decisions ultimately improving efficiency, transparency, and business growth.
