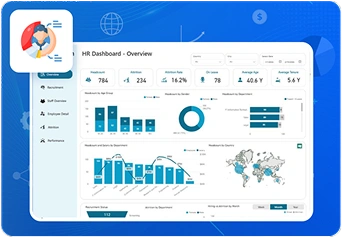
HR Analytics Dashboard
Optimize Recruitment, Retention, and Performance with Our HR Analytics Dashboard.
View More Get It Now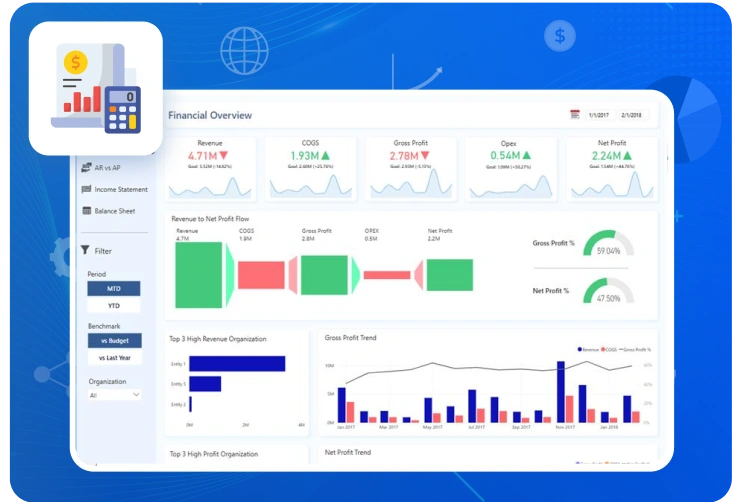
Financial Performance Dashboard
Use Our Financial Performance Dashboard to Track Revenue, Control Costs, and Maximize Profit.
View More Get It Now
Asset Management Dashboard
Maximize Asset Value with Smarter Insights and Real-Time Tracking
View More Get It Now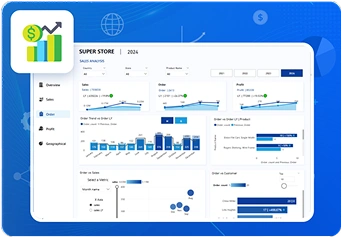
Sales Performance Dashboard
Get a real-time, unified view of revenue, orders, and profits. Explore trends by region, product, or customer segment, and make smarter decisions with interactive, drill-down Power BI visuals.
View More Get It Now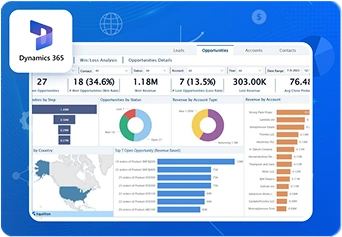
 Power BI App
Dynamics 365 CRM Analytics by Squillion
A powerful analytics app that delivers deep insights into CRM data, enabling effective sales management and customer relationship optimization.
View More Download Now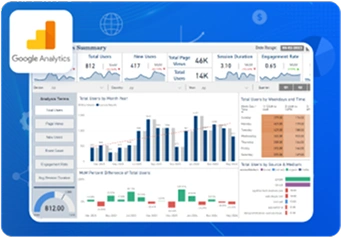 Power BI App
Google Analytics by Squillion
An integrated analytics tool that provides comprehensive insights into website performance, helping businesses optimize their online presence.
View More Download Now